Measuring the performance of real-time digital signal processing code is essential. But whether you're using a simulator or hardware, it can be a headache to get accurate, repeatable performance measurements. In this article we'll cover some of the common pitfalls you might encounter, and present some techniques for working around them.
Why Measure?
Digital signal processing applications typically have tight speed and cost constraints, and may also have challenging real-time deadlines. In most cases, these application requirements can only be met by thoroughly optimized code.
Optimizing signal processing code (and debugging it) is much easier if the software developer can accurately measure the processing time spent in various code segments. This information helps the software developer see where cycles are wasted, assess how close the code is to being optimal, devise code improvements that will improve performance, and observe the performance impact of various optimizations.
To meet real-time performance constraints, the programmer also needs to be able to guarantee that the code will execute within a certain amount of time, every time. Again, this will typically require accurate performance measurements, preferably on hardware that's similar to what will be used in the final system.
Measurement Tools
Engineers measure the performance of their DSP software using either a software simulator or some form of hardware. Simulators are usually easier to set up and use than hardware, and are more readily shared among several engineers. Simulators often also provide the ability to see internal details of the operation of the processor while it is executing code, such as pipeline stalls and cache behavior. This information is extremely useful for code optimization and debugging, and is usually impractical to obtain from hardware. Simulators are often painfully slow, however, which usually precludes the use of lengthy test vectors. Simulators usually can't run applications in real-time—which is an awkward limitation for applications that require real-time interaction with external system components, such as in motor control.
Hardware is faster than simulators, but if the chip is new or still under development, hardware may not be available, or the hardware may have bugs.
Simulator Shortfalls
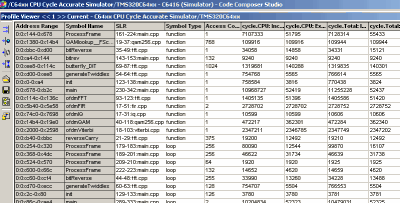
If you're writing code for a DSP processor, you're likely to be able to get a cycle-accurate instruction-set simulator. That's because cycle-accurate simulators are considered a must-have tool for optimizing and measuring the performance of DSP code. (In contrast to DSPs, if you're working with an embedded general-purpose processor or a PC processor, you'll find that cycle-accurate instruction-set simulators are less common. General-purpose processor vendors typically don't design their tools with the needs of real-time signal processing software developers in mind.) Figure 1 shows a screen shot of simulator/profiler output from Texas Instruments' Code Composer Studio.

Figure 1. Simulator output from Texas Instruments' Code Composer Studio.
"Cycle-accurate" is a relative term, however. Instruction-set simulators are usually only cycle-accurate for the processor core and possibly level-one memory; they rarely provide cycle-accurate models of caches, peripherals, I/O, or other levels of memory. One problem we've encountered is that simulator documentation often doesn't clearly explain the boundary between what is accurately modeled and what isn't—which can lead to unwanted surprises when the code is finally run on hardware. (This is particularly true for newer processors with immature tools.) It's a good idea to devise a few simple tests to gauge the accuracy of the simulator rather than relying entirely on the vendor's documentation. Don't assume that the simulator (or documentation) is complete, or even correct.
To verify a simulator’s cycle-accuracy, you need to know how many cycles a given code fragment should require. Read the vendor's descriptions of pipeline behavior (including forwarding paths) and instruction latency and throughput, then construct code examples that exercise instruction sequences that are important to your application and have relatively complex pipeline behavior or latency. For example, load-use latency is often a critical issue in performance-optimized signal processing algorithms, as is multiply-accumulate throughput and latency. Construct small fragments of code that specifically test these relationships—particularly where longer latencies exist—and verify that the simulator accurately models cycle counts. A similar methodology can be applied to verifying latency and throughput of the memory hierarchy.
SOC Simulation
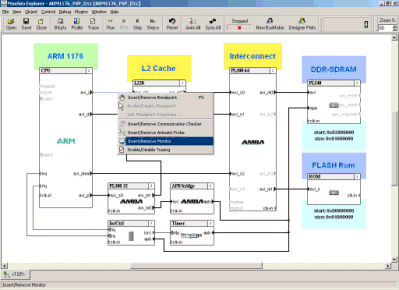
In some cases you may have access to an "SoC" (or "ESL") simulator. This tool allows users to connect various component models (e.g., models of a processor core, cache controller, and buses) to form a cycle-accurate simulator for the whole chip. Figure 2 shows a screen shot of an SoC simulator for the ARM1176.

Figure 2. SoC simulator for the ARM1176
Such a tool is especially useful if the SoC is under development, and therefore is not available in hardware. The challenge with this approach is that it can require a big investment to build and verify this kind of model. It's usually impractical for software developers to develop SoC models themselves if there isn't already one available from a tool or processor vendor.
Hardware Headaches
There are several forms of hardware that you might use for measuring performance. These include the actual production board used in the end product, or a prototype of the end product, or a development board provided by the chip vendor. Development boards typically contain the actual processor chip, but in some cases (if the chip isn’t yet available, for example) they may contain a lower-speed FPGA implementation of the processor.
Running your DSP program on hardware that's similar (or identical) to that used in the end product is usually the most accurate way to verify performance—but a key problem is that the hardware may not have been designed to enable easy, accurate cycle count measurements. Some chips have sophisticated built-in performance monitors that allow you to determine (for example) cycle counts for various sections of code, L1 cache misses, and the number of times a particular address is accessed. Other chips have less-sophisticated capabilities, or no on-chip performance monitors at all.
If the chip doesn't have a performance monitor, you may be able to use an on-chip or on-board timer to determine elapsed time—but some timers don't have sufficient resolution to provide accurate cycles counts. If the chip doesn't have timers or they don't enable sufficient accuracy, one work-around is to write code that toggles an output pin of the chip at two points in the code, observe the pin on a scope, and measure the elapsed time. This approach provides accurate measurements, but can be cumbersome.
A potential problem with using development hardware for performance measurements is that its behavior may differ from that of the final product hardware. Differences in cache sizes or configurations, bus widths or speeds, DRAM performance, etc. may have a significant effect on the performance of the code. You can take measurements on one configuration and extrapolate the results to another—but it can be extremely difficult to make accurate estimates, because the factors described above tend to layer upon each other to create a hard-to-predict impact on performance.
As an example of the kinds of problems you might encounter, we recently implemented a signal processing application on an embedded general-purpose processor where the simulation capabilities were not sufficient to measure the performance of the code and optimize it. So we obtained a development board and hooked it up to an emulator with real-time trace capability. Unfortunately, we still weren't able to get accurate real-time performance measurements.
The emulator’s trace facility initially couldn’t keep up with the processor running at full speed, so we had to slow down the processor clock. But this changed the ratios of the CPU clock to various bus clocks, making cache misses appear less expensive than they really were. It didn’t make sense to measure performance and optimize the code for cache behavior that would change once we were running in real-time—we needed another solution. With assistance from the processor vendor, we got tracing running at full speed, but then faced other obstacles. The trace would tell us that there was a stall, but wouldn’t tell us exactly where the stall occurred relative to our code or why it was happening. We had to devise experiments to map the trace to what was actually happening in the code. Overall, it turned out to be much harder to get good performance measurements and optimize the code than we'd anticipated.
Dueling Data
DSP software developers often perform initial debugging, optimization, and performance measurements using a simulator and then switch to hardware to integrate software components and verify performance. Unfortunately, it's not uncommon to find that the performance figures measured on hardware don't match those that were obtained using a simulator. This may be because the simulator wasn't cycle-accurate, or the hardware has bugs, or the two environments were configured differently. Software developers may need to understand why the two measurements differ to help determine which (if either) is correct. It's often assumed that the hardware measurement is correct, but this can be a mistake if, for example, the hardware wasn't properly configured.
Getting Data In and Out
In some DSP systems, processing load depends on the values of the data being processed. This presents challenges to developers who need to ensure robust real-time behavior of their systems. A full characterization of such a system's performance can require vast amounts of data to be streamed in and out. This can be problematic for simulators, since they may run so slowly that a full test takes several weeks, or longer. It can also be a problem for hardware boards if they don't support high-speed streaming data. JTAG ports typically aren't fast enough to support streaming large amounts of data in real time. Furthermore, boards that are similar to the final product may not be set up to support convenient digital I/O connections. (For example, a portable media board may be designed such that the only video output is the one that drives the LCD.) A workaround that can be effective in some cases is to set up a data generator and a checksum-calculator in software to avoid streaming data on and off the board.
Trust a Little, Verify a Lot
Getting accurate performance measurements is a key part of testing and optimizing signal processing code, but it's often not straightforward. Whether you're using a simulator or hardware, you're likely to find that getting good performance info isn't a push-button process. You'll need to spend some effort making sure that the numbers you get are sound. Don't assume that the simulator or the hardware provides completely accurate cycle counts; run some tests to verify this for yourself. You might be surprised by what you find out.


Add new comment