Comparing licensable processor cores and quantifying their relative performance is challenging. Unlike processor chips, there are many different ways in which licensable cores can be configured, implemented, and fabricated, each of which yields a different combination of speed, area, and power consumption. Particularly for digital signal processing applications (which tend to push the limits on one or more of these metrics) it’s essential to have reliable and accurate performance data.
To make apples-to-apples comparisons between cores you’ll need to pin down a consistent set of assumptions. In this article, we’ll discuss some of the factors to consider when assessing and comparing licensable cores for digital signal processing.
What will you really get?
Choosing a core requires a careful analysis of its speed, area, and power consumption. Making this assessment is difficult, however, because there are many factors that affect the speed you’ll get when you actually fabricate a chip.
The fabrication process in which a core is implemented has a profound effect on every aspect of its performance—including its speed, size, and power consumption. In general it doesn’t make sense to compare the performance of cores that have been fabbed in different processes; the performance characteristics of the cores themselves are likely to be obscured by differences in the fab processes. To make fair comparisons you’ll need to compare all the cores in the same process.
Even for a specific process, the clock speed and power consumption of a core will vary between fab runs. For this reason, core performance is typically specified in terms of worst-case and typical values.
SoC designers typically design their chips for worst-case clock speed—based on worst-case voltage, temperate and process parameters. This allows them to eliminate process variations as a variable in final performance, and avoids the cost of speed sorting. SoC designers, therefore, need to see benchmark results based on worst-case clock speeds.
Unfortunately, core vendors often base their benchmark results on typical clock speeds rather than worst-case, for obvious reasons. A common justification is that the core is being compared to off-the-shelf chips, which can be speed-sorted. From the SoC designer’s perspective, this is irrelevant—SoCs are rarely speed-sorted, so SoC developers need worst-case numbers.
Later is better
The clock speed, power, and area reported for a core are known with varying degrees of certainty at different points in the implementation of a chip. To accurately assess and compare core performance, it’s best to use values that are generated after the core has been fully placed and routed. If the values are measured after synthesis but before place-and-route, they’re much less reliable. To help ensure consistency across cores, the values should be measured using industry-standard timing analysis tools and techniques.
The memory question
Most licensable processor cores allow you to connect your own memory subsystem; you can typically choose the size and speed of caches and other on-chip memory blocks. Unfortunately, when core vendors report performance, they sometimes make unreasonable assumptions about the memory system.
For example, a core vendor might assume that the core will be hooked up to prohibitively expensive high-speed memories, or make unrealistic assumptions about the cache size. An unrealistically large cache (or other L1 memory) may reduce cycle counts, but may be too slow to allow the core to run at full speed. Conversely, an unrealistically small cache may allow faster clock speeds at the expense of greater cycle counts. These kinds of assumptions can make the core look better than it really is.
Unfortunately, most core vendors don’t show their memory assumptions alongside their benchmark results. It can be difficult to figure out whether the speed results for cores from different vendors are really comparable (or whether they’re meaningful at all, for that matter).
Adding up the area
In addition to speed, a common metric used for comparing licensable cores is the core’s silicon area. There are a couple of ways that core vendors report area. A vendor might choose to report only the area used by the processor logic itself or it might report the floor plan area—which includes “white space” that’s not used by logic but is leftover silicon that’s embedded within the core.
Depending on its location and size, it’s possible that some of this white space could be recovered for use by the SoC designer. If the core occupies a rectangle and a big square chunk of white space is right at the edge, for example, then it’s likely that this space is usable. If it’s an oddly shaped piece in the middle of the rectangle then it’s probably useless. If you need reliable data on core size, you’ll need to make sure you understand exactly what’s being included in the tally.
Small or fast
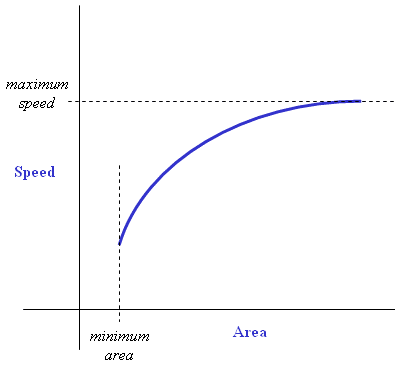
The silicon area required by a core is also affected by the way the chip designer chooses to synthesize the core. Logic synthesis tools allow the system designer to specify speed or size as the primary optimization goal—as shown in Figure 1, one generally comes at the expense of the other. (Power consumption tends to be closely coupled to area, so this metric is also affected by the synthesis optimization goals.) It’s important to know what synthesis constraints were used to generate the core; if one core was synthesized for minimum size and the other was synthesized for maximum speed, comparisons must be made with caution.

Figure 1. Core speed vs. area trade-off for a specific voltage, temperature, and process.
Similarly, core vendors typically choose a specific logic cell library to implement their chips. The library components can be optimized for speed, for area, for power consumption, or for some combination of the three. If you want apples-to-apples comparisons, you’ll want to make sure that all of the core implementations you’re comparing use the same library.
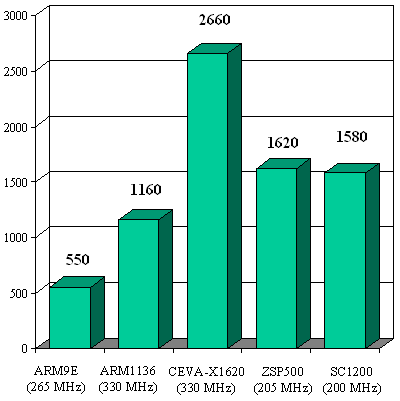
Figure 2 illustrates the BDTIsimMark2000™ scores for a selection of licensable cores. (The BDTIsimMark2000 is an overall measure of DSP speed based on a processor’s results on BDTI’s DSP Kernel Benchmarks; higher is faster.)

Figure 2. BDTIsimMark2000™ scores for selected licensable cores. BDTIsimMark2000 scores are based on simulations, not measured on hardware. All scores © 2006 BDTI; additional scores at BDTI's web site.
It’s not just how small you are
While core size can be important, this metric is often misleading. That’s because in chips that use embedded processor cores, the area used by the core is often negligible compared to the area eaten up by memory banks. It’s common for the processor core to consume only about 10% of the die area, with 60-80% consumed by memory. Thus, in typical embedded chips, the size of the core itself may not be that significant in determining overall chip size.
This doesn’t mean that it’s not important to choose a core that will minimize chip size (and hence cost). But comparing core area usually isn’t the best way to go about making this choice. A better metric to use for this purpose is processor memory efficiency.
Memory efficiency measures how much memory is required for the core to execute a given task. It includes both program (instruction) and data memory. The core’s architecture and instruction set exert a direct influence on its memory efficiency; the quality of the compiler can also play a critical role.
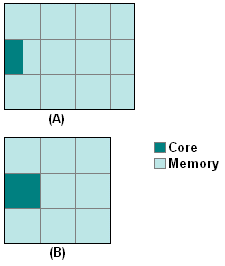
Because embedded chip size tends to be dominated by on-chip memory, the size of memory required by the core has a dramatic impact on the overall chip size—a greater impact than the size of the core itself. To illustrate this concept, imagine that Core A is 50% smaller than Core B, but uses 30% more memory (Figure 3). Assuming that Core B requires an 8:1 ratio of memory area to core area, it turns out that the bigger core will yield a smaller chip. Of course, the chip designer can always skimp on memory to make the chip smaller, but then the system designer has to make up for the shortfall by adding off-chip memory banks. This can increase system cost and energy.

Figure 3. Due to differences in memory efficiency, a bigger core can yield a smaller chip.
Confounding configurables
Configurable core vendors attempt to address this difficulty by providing examples of the performance improvements afforded by configuring the core, which is useful if your application is similar to the one used in the core vendor’s example. Vendors sometimes muddy the waters, however, by providing speed, power, and area data for different core configurations. Make sure you understand which configurations yield which performance characteristics, and don’t assume that you’ll get all of those performance figures out of a single core.


Add new comment